Your yard, on screen
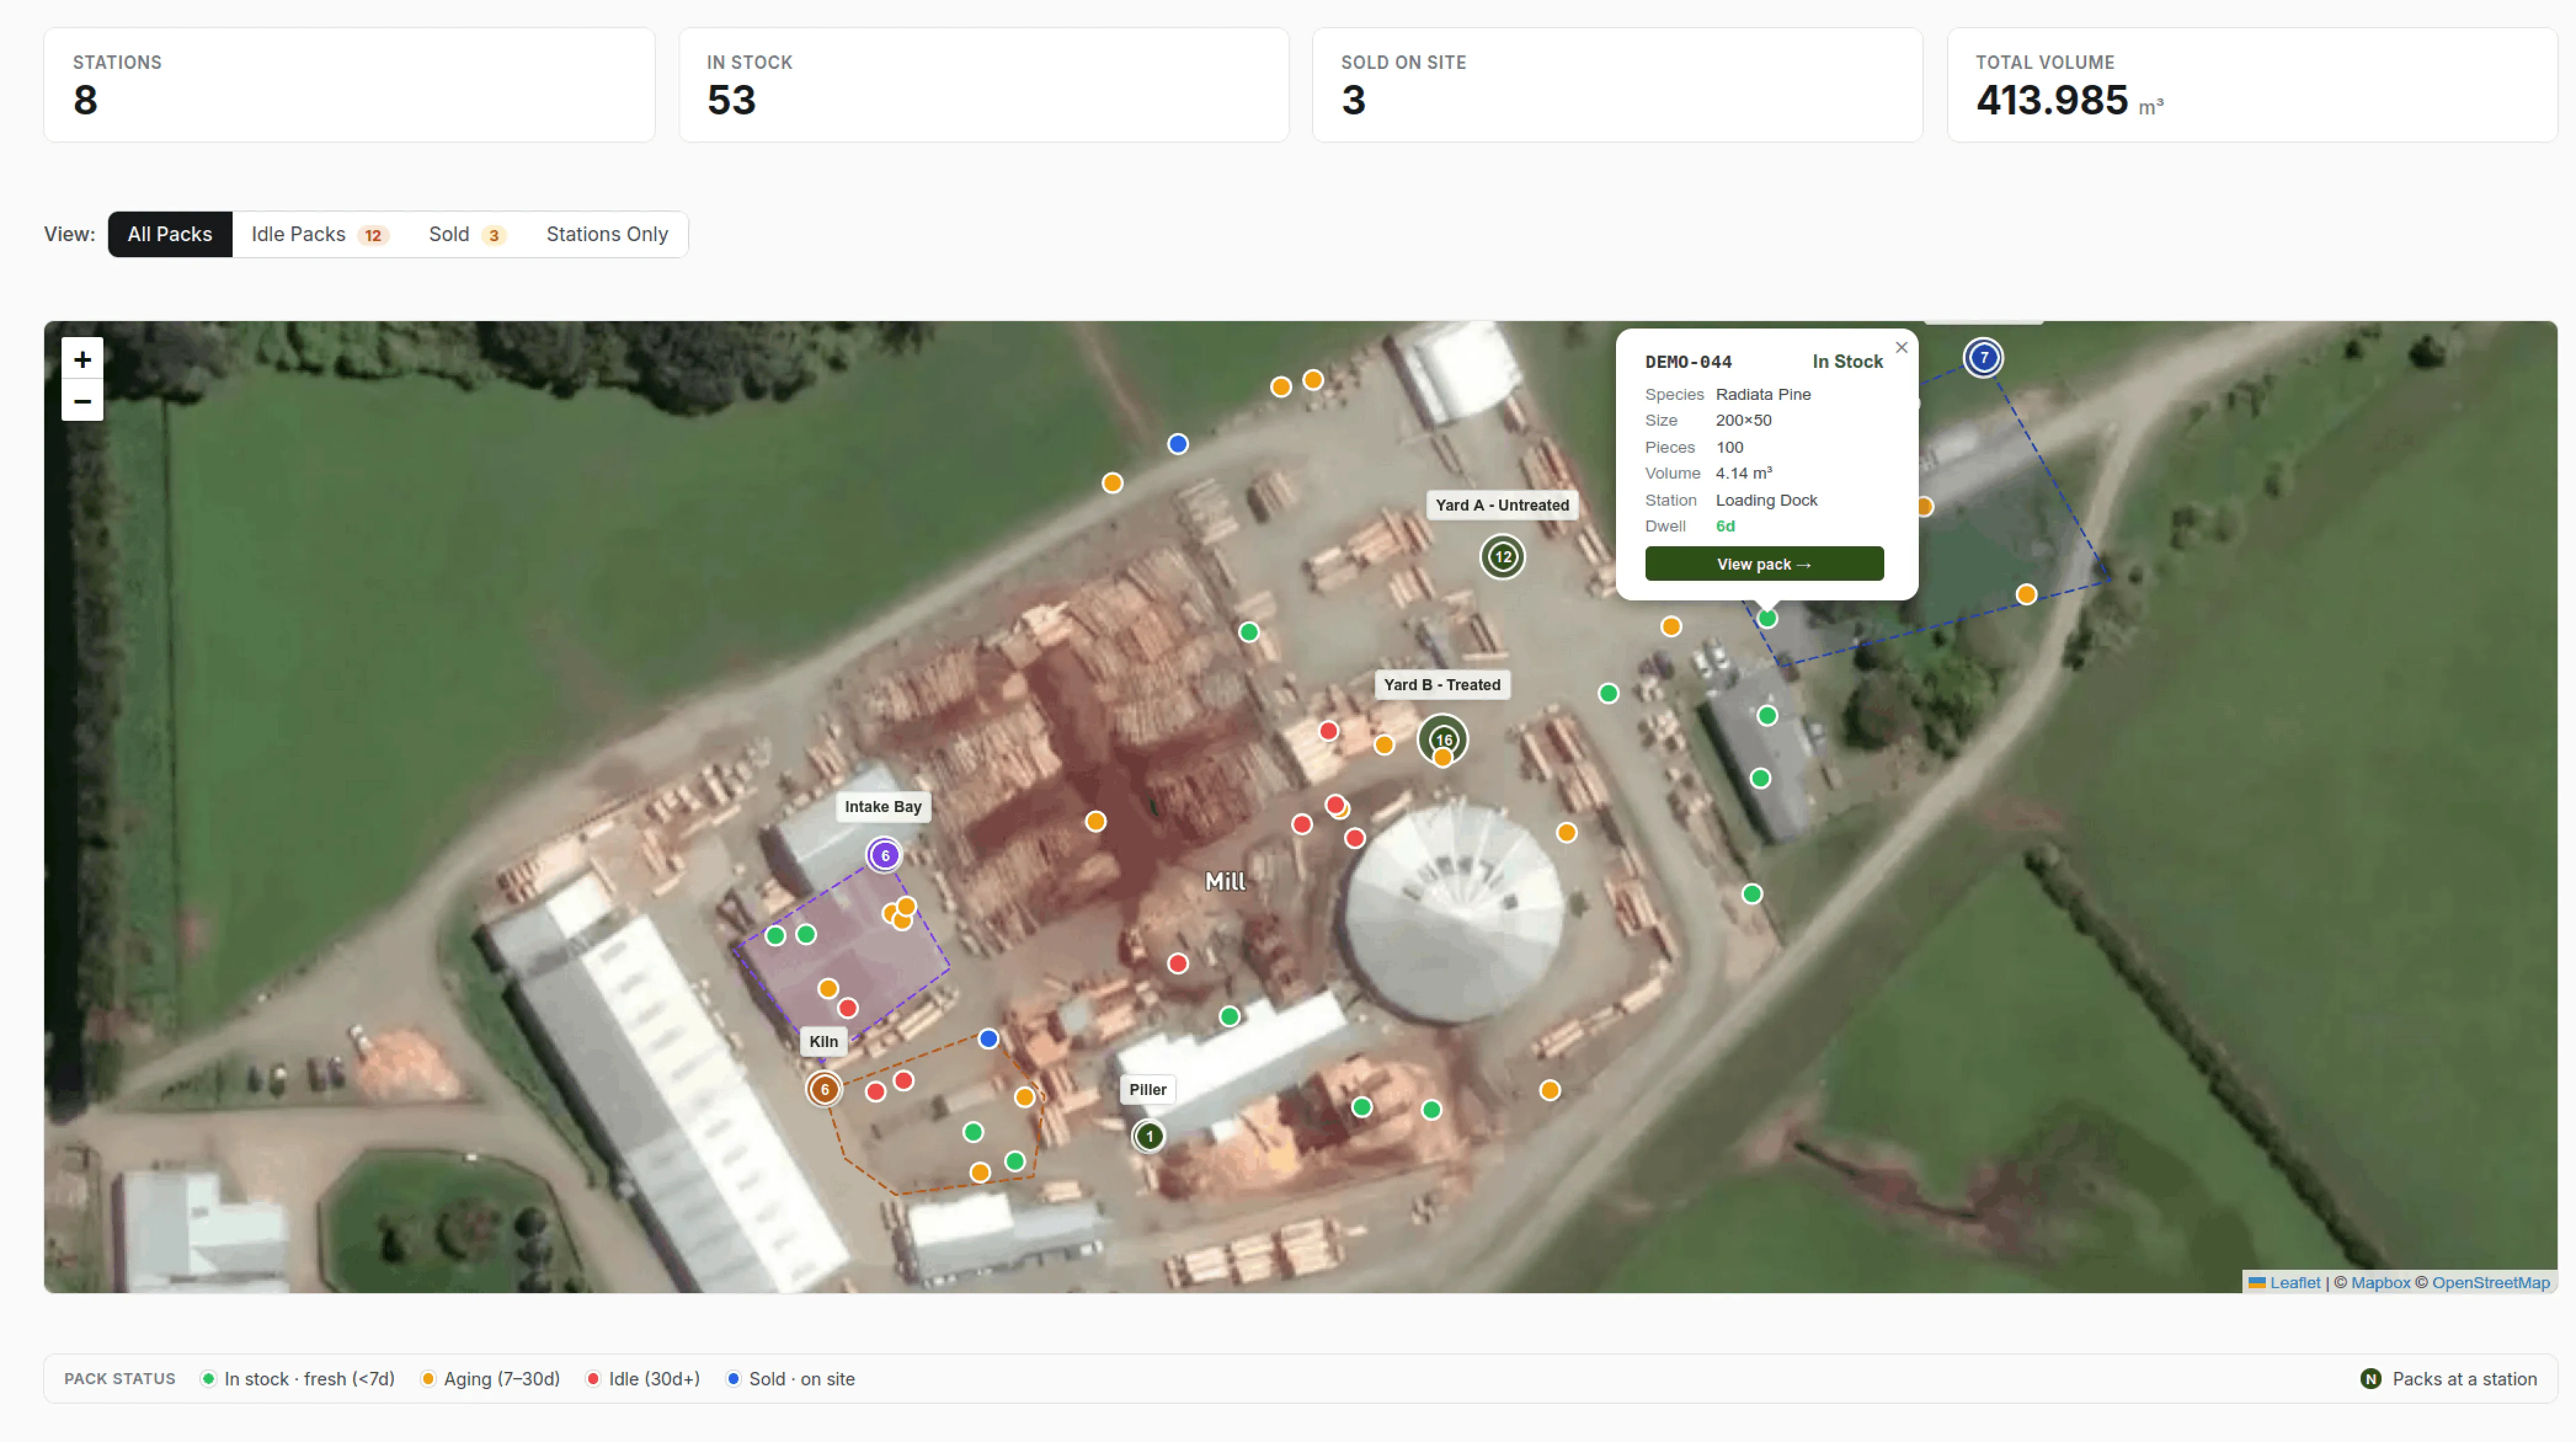
Timberflow’s site map shows every station in your yard on an interactive map, with pack counts and total volume overlaid on each location. At a glance, you can see where your stock is concentrated, which stations are full, and which are empty.
Draw your stations on the map
Setting up a station takes seconds. Open the satellite view of your yard and draw a polygon around the area - the kiln, Yard B, the loading dock - and that’s your station boundary. No surveying equipment, no GPS hardware, no manual coordinate entry. You see your actual yard from above and trace the shapes that match how you already think about it.
app.timberflow.co.nz
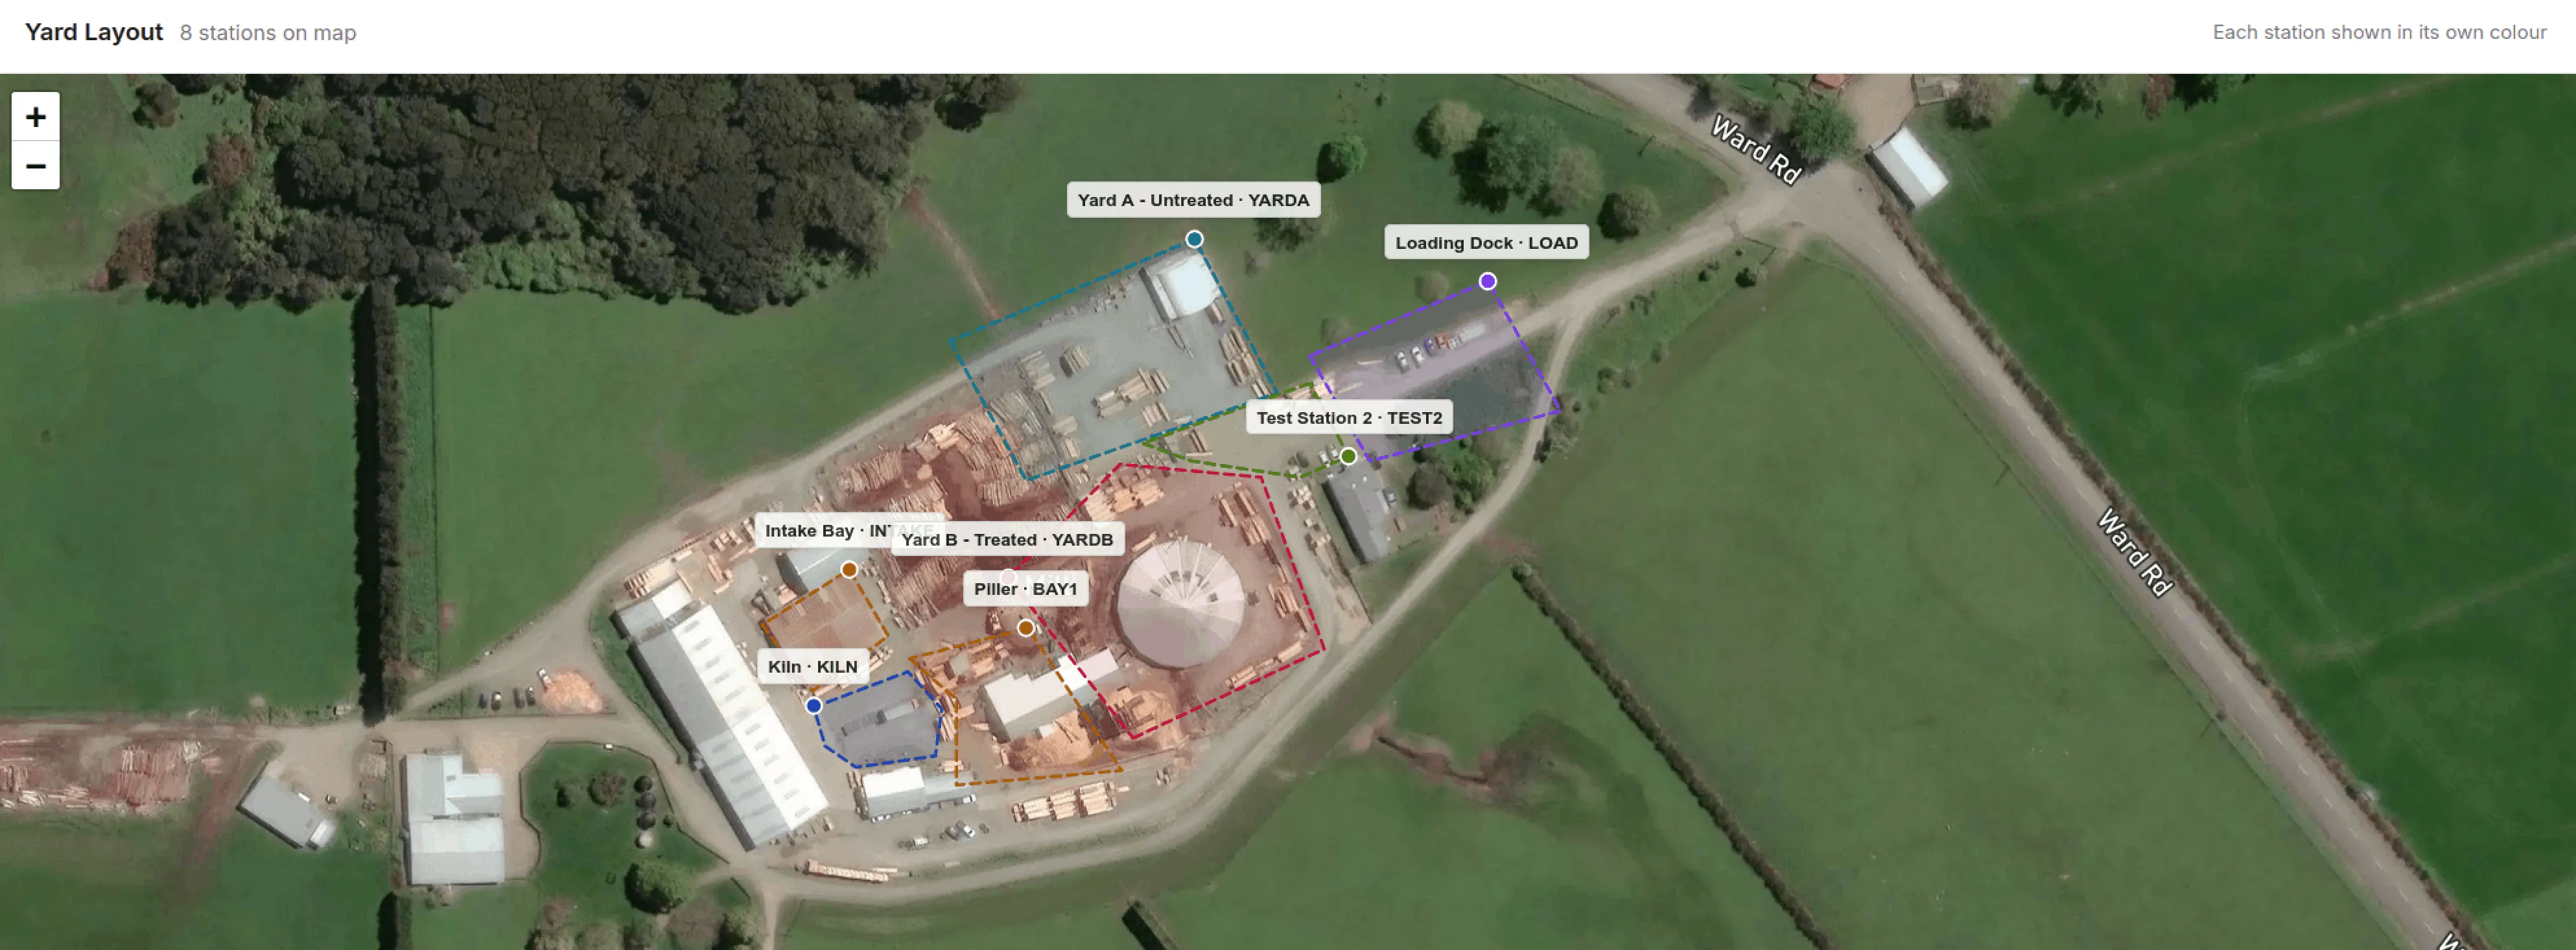
Because stations are real areas rather than single points, packs are assigned automatically: when a pack’s scanned GPS position falls inside a station’s polygon, it belongs to that station. Move a pack into the kiln zone and the map knows.
Know what’s sitting too long
The map highlights stations where packs haven’t moved in 30+ days. Stale inventory ties up yard space and capital. The actionable insights panel surfaces these automatically so your team can investigate - is it waiting for treatment? Waiting for a customer? Or just forgotten behind the kiln shed?
Connected to everything else
Every station on the map links to its packs. Click a station to see what’s there, then drill into individual packs for full history. Movement scans from barcode scanning update station pack counts in real time. When a forklift moves a pack, the map reflects it automatically.
The site map works alongside the inventory dashboard and stocktake features - the dashboard tells you what you have, the map tells you where it is, and stocktakes verify both.